Guest Blogger: Dr. Sean McBride
- What is Blackboard, currently known as MU Online?
- How often does the current generation of tech savvy students really use Blackboard?
- How hard is Blackboard to use as a professor?
- I use Blackboard, but I wonder which students are actually looking at the material I have posted?
- What day of the week and hour of the day do they access Blackboard?
- How long does each student spend in Blackboard and what are they looking at?
- Will my students check Blackboard more often than if I just post class material on the cork board outside my office?
- Is there any data that suggests students who access the material posted in Blackboard perform better than those students who chose not to access the provided materials in Blackboard?
 These were some of the questions I had prior to becoming a novice Blackboard user. My name is Dr. Sean P. McBride. I recently started at Marshall University in fall of 2016 as an Assistant Professor in the Physics Department. I have found that once you have your course set-up in Blackboard, you can very easily and quickly get answers to all these questions and much more within only a couple of mouse clicks. The first thing you need to do to start answering these questions for your own course is see the experts at the Design Center in Drinko Library (Room 235, Monday – Friday, 8:00 am – 4:30 pm, 304-696-7117, designcenter@marshall.edu). They will help you set up everything up for your course in Blackboard from start to finish. It is best to set-up Blackboard before the start of a new semester, but any time is a great time to start learning. Throughout each semester, the Design Center team routinely offers training and refresher workshops for all faculty. These workshops are highly advantageous to help novice users learn the capabilities of Blackboard.
My aim is to provide you with a description of classes that I have incorporated Blackboard into and how I use Blackboard to achieve the objectives of those classes. At the end of this discussion I will provide you with the statistical data in the form of plots generated by Blackboard. These plots will help provide answers to the original questions that were stated at the beginning. The data used for the plots is extracted from one of my own classes this spring 2017 semester. I will continually update these stats for this particular class on my own personal teaching web page (http://www.science.marshall.edu/mcbrides/teaching/).
Among the courses I have taught here at Marshall, in which I have incorporated Blackboard, are algebra based College Physics I and University Physics I. These courses focus on providing students with a basic understanding of Mechanics, Waves, and an introduction to Thermodynamics and each requires students to learn how to apply physics concepts to solve real world problems and not just rely on memorization techniques. Both courses provide students with structured lectures three times a week (3 – 4 hours in total), written and/or web based problem solving assignments are due once per week, and there is a total of 4 -5 in-class exams given in each class. The web based homework is opened up through a portal using Blackboard, so students’ activity on the web based homework can be monitored. To succeed in these classes, students not only have to learn basic physics, but also have to prove their critical thinking, analysis, problem solving, and quantitative reasoning skills. These courses are made up of students that major in Biology, Biological Science, Biochemistry, Computer Science, Digital Forensics, Secondary Education, Exercise Science, Geology, Physics, and various types of Engineering just to name a few.
In introductory courses such as these, I am a firm believer that students should have access to all the course materials at any time, day or night. For me this this where the secured classroom file storage space, called ‘Course Content’ provided by Blackboard comes in and helps me achieve this goal. Only current Marshall University students enrolled in the current class, who have a MUNet ID and password, can access and view the material posted for their specific course. I post everything that is done in class in Blackboard to this area, including lecture notes, the syllabus, equation sheets, homework help documents, links to resources out on the world-wide web such as calculus refresher lectures, links to free downloadable math and physics textbooks, and a links to physics simulations that allow students the opportunity to play around in a virtual environment testing physics concepts. The fantastic part about all this is that you can set-up each item in Blackboard to track how many times it is viewed/opened or how long someone has looked at it, allowing you to get numerous important statistics on each of your students and/or the class as a whole.
I also use the Gradebook feature in Blackboard (in addition to keeping an Excel back-up of the grades). The Gradebook feature in Blackboard allows the students to know instantaneously and exactly what their overall grade is as graded assignments are added. The Design Center team members will help you set-up weighted columns for any complicated grading scheme or distribution you can imagine for your course. In conjunction with Blackboard, I also use another software program to make histograms of the current grade distribution so the students can take their grade given by Blackboard and compare it to a visual histogram of the grades from the rest of the class. This histogram is made available to all students in Blackboard and the individual student can then easily see where they fall relative to their peers. Doing this allows the students at the lower end of the grade spectrum to realize that even though physics is hard, there are students excelling in the course and they need to work harder if they want to be one of those students. The key to this self-motivation for the students is to know exactly what their grade is at any instant and be able to compare to the overall grade histogram, Blackboard provides them this opportunity. Blackboard also allows you to plot the student grades as a function of the number of times they have accessed Blackboard. The data from my class used in the figures at the end suggests there may be a correlation between the overall grades and the number of Blackboard accesses.
Most importantly, to complete the learning cycle, I also post solutions to both the written and online homework, quizzes, and exams in Blackboard. Posting the solutions allows the students the opportunity to learn from their mistakes. Almost everything in both of these classes is cumulative, so if they see it once in the class, chances are they will see again, and if they got it wrong the first time, they understand they need to learn how to do it correctly for the second time. If they cannot come to office hours or what I call HERD Hours, then Blackboard provides them a convenient easy way to access the solutions and learn from their mistakes at any time. Blackboard easily allows you to check which students are looking at which documents you post, how long they look at those documents, and thus who is making and effort to learn from their mistakes. If interested, more information about HERD Hours is posted on my teaching website (http://www.science.marshall.edu/mcbrides/teaching/), but in essence it is a place where students can come individually, or especially in groups, and work on homework together in a non-classroom and non-typical-professor-office-hour setting.
Below are the plots generated by Blackboard with some added supplemental notation that I like to use to characterize the general performance of a class and address some of the initial questions mentioned at the start of this discussion. Since no specific grade information is tied to a specific student, the plots they can be publicly displayed and are not in violation of any known FERPA laws. All activity presented includes only the students, not professors, not observers, nor designers. To explain the observed weekly log in times it should be noted that the web based homework is due Sundays at 11:59pm, written homework is due Monday morning first thing in class, and there is a quiz or exam every Wednesday. HERD Hours this semester is from 1-5pm on Fridays, so presumably, the online activity drops in favor of the face-to-face time. These correlates well with the decline in web based user activity reported by Blackboard for Fridays. For the 26 students still participating in the class, including data up to 4-7-17, HERD Hours has received 88 visits from a total of 13 students, each staying 2 – 3 hours per visit on Fridays.
In summary, this course has had 9,660 page hits from the 26 remaining students enrolled and the entire class from day 1 has logged nearly 763 hours outside of class on Blackboard; so yes, the current generation of tech savvy students really do use Blackboard and the specific students that use it seem to do better in class.
Keep in mind my use of Blackboard features discussed here just scratches the surface of its true potential. For writing intensive courses, SafeAssign in Blackboard may be of interest to you (a feature of Blackboard that checks the web and compares documents for plagiarism), or you might find Rubrics, Retention Center, or Discussion Boards useful. The fastest way to learn more about Blackboard and its features is to contact the experts at the Design Center, designcenter@marshall.edu. Feel free to contact me as well with any questions you may have.
Dr. Sean P. McBride
Physics Department
Office: Science Building 152
(mcbrides@mashall.edu)
Teaching Homepage: http://www.science.marshall.edu/mcbrides/teaching/
Research Homepage: http://science.marshall.edu/mcbrides/
Main Page: https://works.bepress.com/sean-mcbride/
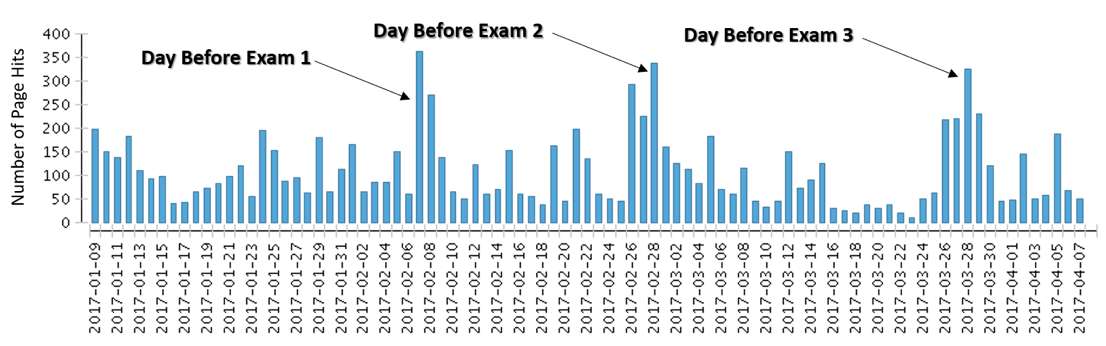
Figure 1 – Illustrates the number of page hits as a function of each day in the semester so far. The points at which the exams were given can easily be seen. Based on the increased activity for exam 2 and exam 3, one could speculate that after the first exam the students learned to start studying a few days in advance prior to the exams instead of just the day before like on exam 1.
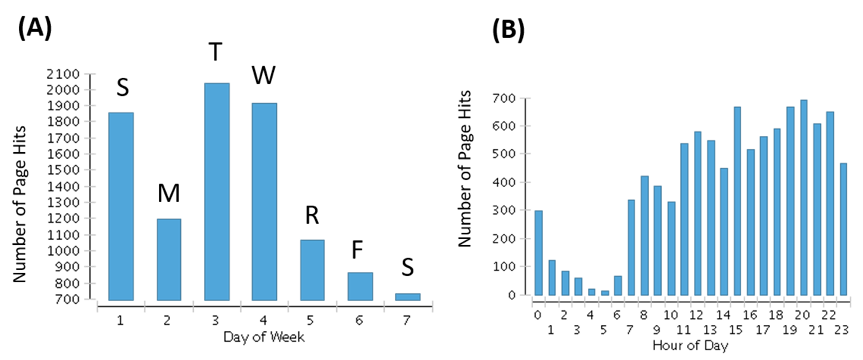
Figure 2 – (A) Illustrates the number of page hits as a function of each day in the week. Clearly most students spend Sunday night doing the web based homework. Tuesday appears to be reserved for studying for the exam or quiz on Wednesday. (B) This plot illustrates the number of page hits as a function of each hour in the day. From this I have learned 5 am is the least active time for students getting work done outside of class, while 3 pm and 7-8 pm seem to be the peak activity times in Blackboard on any given day.
 Figure 3 – Examines the relationship between overall course grade and the number of course accesses on Blackboard. Even neglecting the extrema for this course, there seems to be convincing evidence that there is a correlation between overall grade % and the number of course accesses.