A Practical Alt Text Guide and Strategies for Accessible Images, Diagrams, and Equations
Purpose
Because STEM learning often depends on diagrams, graphs, models, equations, maps, and other visual representations, effective alt text is essential for ensuring accessible and equitable access to course content. This resource helps STEM faculty develop a practical workflow for addressing alt text needs and creating meaningful image descriptions that remove accessibility barriers. Using a four-stage alt text triage process, faculty will learn how to determine which visuals require immediate attention, distinguish between short alt text and longer descriptions, and write image descriptions that communicate instructional meaning rather than appearance alone. Faculty will also learn how to leverage practical resources and tools, including Microsoft Copilot, EchoVideo transcripts, Microsoft Word, PowerPoint, Adobe Acrobat, and Blackboard, to efficiently create accessible STEM course materials.
Why This Matters
How does this challenge affect access, learning, independence, or belonging?
By improving access to diagrams, graphs, models, equations, and scientific imagery, faculty can support student learning, reduce learning barriers, enhance student autonomy and engagement, and advance Universal Design for Learning principles and accessibility requirements within STEM learning environments.
STEM Image Triage at a Glance
| Triage Stage | Key Question | Possible Action |
|---|---|---|
| Stage 1: Essential and easy fix | Do students need the image for learning or assessment, and can I fix it quickly? | Use Blackboard Ally auto-generated alt text and edit as needed for accuracy. |
| Stage 2: Essential but complex | Does the image require more time or interpretation? | Use EchoVideo transcripts to help you create longer STEM image descriptions. |
| Stage 3: Lower Priority | Can this item be postponed without preventing students from completing required work? | Delete images that are no longer needed, or move images to a development shell to remediate later |
FAQ for STEM Alt Text
If an image does not convey instructional content, information, or functionality, it may be treated as decorative rather than meaningful content. Decorative images should be marked as decorative so that screen readers can skip them instead of announcing unnecessary information. Common examples include visual dividers, decorative icons, background images, borders, and purely aesthetic graphics that do not support learning objectives or course navigation.
Key question: Would students lose any instructional information if the image were removed?
- If yes, provide alt text or a longer description as appropriate.
- If no, mark the image as decorative.
Note: If you are unsure whether an image contributes to learning, instruction, navigation, or functionality, it is generally better to provide alt text or another accessible alternative than to mark the image as decorative. If the image contributes to the instructional experience in any meaningful way, students should have access to the information it conveys. Thus, when in doubt, provide a description.
For many complex STEM, scientific, mathematical, and data-rich graphics, WCAG does not require every detail to be crammed into the image’s alt text field. Instead, for more complex diagrams, flowcharts, maps, infographics, equations, and scientific figures, an effective approach is to provide concise alt text (a small alt text description in the field) along with a separate long description (in the notes, a caption, a separate document, or URL).
Alt text is only one component of image accessibility. Graphs, charts, equations, tables, and scientific figures may require additional accessible formats, captions, data tables, or long descriptions to provide equivalent access to the information being presented. The goal is not simply to add alt text, but to ensure that students can access the same instructional content and learning outcomes conveyed through the visual.
The recommended steps include the following:
- Provide short alt text for the image itself.
- Then, provide a longer description elsewhere OR link or refer users to the longer description.
- Ensure the longer description contains all educationally relevant information.
Key question: Can this image be accurately described in two or three sentences?
If yes: Use standard alt text only.
- If no: First, write brief alt text, and second, provide a separate detailed explanation. Be sure to refer to where the separate detailed explanation is located. That is, if the description is not immediately adjacent to the image, the student must be directed to it.
- Directly below the image, using a heading or label such as “Detailed Image Description.”
- In the surrounding document text, immediately before or after the image.
- On the same Blackboard content page, placed near the image.
- In an expandable section, such as “Select to read the detailed image descriptions.”
- On a separate linked Blackboard page, clearly labeled with the image or figure number.
- In an appendix at the end of the Word document, PowerPoint, PDF, or course module.
- In PowerPoint speaker notes, provided the notes are distributed to students in an accessible format. (Note: Speaker notes will not transfer from the PowerPoint if it is converted to a PDF).
- In an accessible companion Word or HTML document, linked next to the image.
- In an accessible data table, when a graph or chart presents values that students need to examine.
For assessment-related or exam visuals, provide an accurate description that preserves the validity of the assessment. In some cases, the visual may require only a brief description of its type and subject, along with the corresponding exam item number (for example, “Exam Question 1: Line graph showing population growth over time”). The goal is to provide equitable access to the visual without revealing information that would invalidate the assessment. Consult the HELP Program or accessibility support members when determining the appropriate level of detail.
It depends on the visual. There is no WCAG rule requiring every image to be described from top to bottom, left to right, top to bottom, etc. However, use a directional sequence only when spatial arrangement is important to understanding the visual, and be sure to signal where the description starts. For most STEM images, the key thing to remember is that you want to give the screen-reader user a mental framework before presenting details. Guidance from the World Wide Web Consortium recommends that descriptions of complex images communicate the image’s essential information, including relevant structure, relationships, values, and trends.
Also, keep the F.I.T. formula in mind when writing in a certain direction.
- Format: What is it? → Identify the image type.
- Important Information. Why is it here? → Explain its instructional purpose.
- Takeaway: What should students learn from it? → State the important information.
The F.I.T. Framework for STEM Alt Text
Alternative text, or alt text, is a written substitute for the information or function communicated by an image. A screen reader announces the alt text when it encounters the image, allowing a student who cannot see the visual to access its essential meaning. WCAG Success Criterion 1.1.1 requires meaningful non-text content to have a text alternative that serves an equivalent purpose. The goal is not to describe every visible detail. The goal is to communicate what students need to understand or do because of the image.
Consider using the following framework: Format + Important Information + Takeaway (F.I.T.).
- Format = Identify the type of visual you are referring to. Examples include photographs, diagrams, line graphs, equations, maps, complex figures, or images.
- Important information = Describe the essential content that your students need when viewing the visual, such as the relevant structures, variables, labels, process, or relationship.
- Takeaway = State what students should understand or learn from the visual.
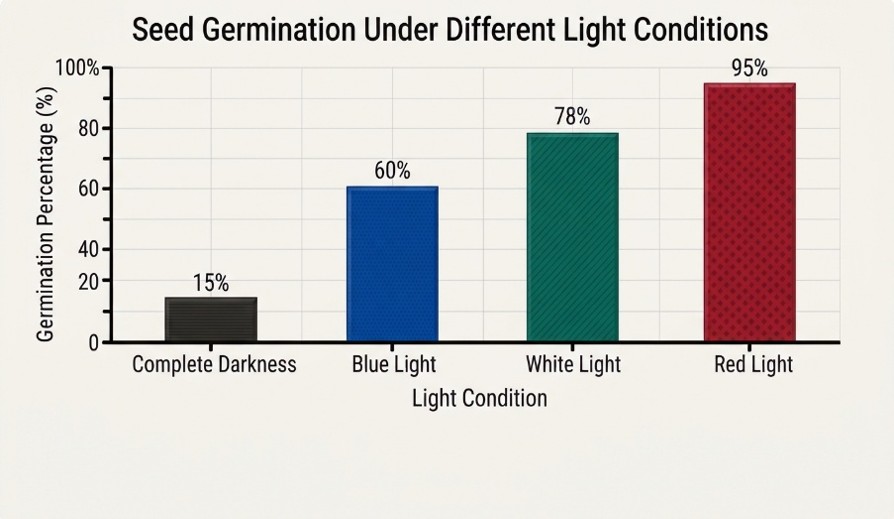
Alt text example: Bar graph comparing seed germination under four light conditions [Format]. Germination is 15% in complete darkness, 60% under blue light, 78% under white light, and 95% under red light [Important Information]. Germination increases across the four conditions, with red light producing the highest germination rate [Takeaway].
Note: The F.I.T. framework is one method for organizing alt text and is intended as a practical guide rather than a WCAG requirement.
Applying F.I.T. to STEM Alt Text
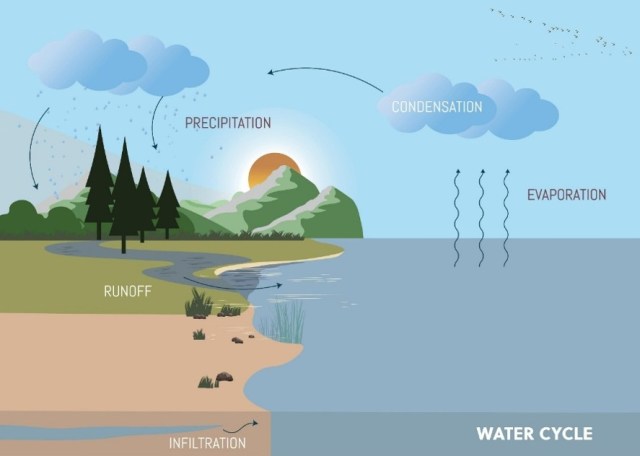
Short alt text description example [counterclockwise]: “Diagram of the water cycle showing the movement of water among the ocean, atmosphere, and land. Beginning at lower right, water evaporates from the ocean and moves upward into the atmosphere. Across the top, water vapor condenses into clouds. On the left, precipitation falls onto the land and returns to the ocean through runoff.”
The directional sequence is useful because the diagram itself presents the appropriate directional cycle.
Use left-to-right alt text descriptions for:
- Timelines
- Horizontal processes
- Before-and-after images
- Experimental sequences
- Graphs with time on the horizontal axis
- Panels labeled from left to right
Use top-to-bottom alt text descriptions for:
- Hierarchies
- Geological layers
- Atmospheric profiles
- Vertical flowcharts
- Anatomical structures in which vertical position matters
- Energy or trophic pyramids
Image rendered from Google Gemini.
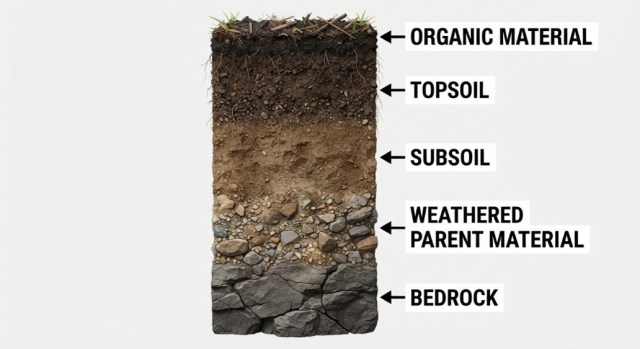
Short alt text description example [top to bottom]: “This is a cross-sectional soil diagram. From top to bottom, the soil profile contains organic material, topsoil, subsoil, weathered parent material, and bedrock.”
Use clockwise alt text descriptions for:
- Cycles
- Circular pathways
- Anatomical cross-sections
- Circular molecular diagrams
Use center outward alt text descriptions for:
- Cell diagrams
- Atomic models
- Radial diagrams
- Concept maps
Image rendered from Google Gemini.
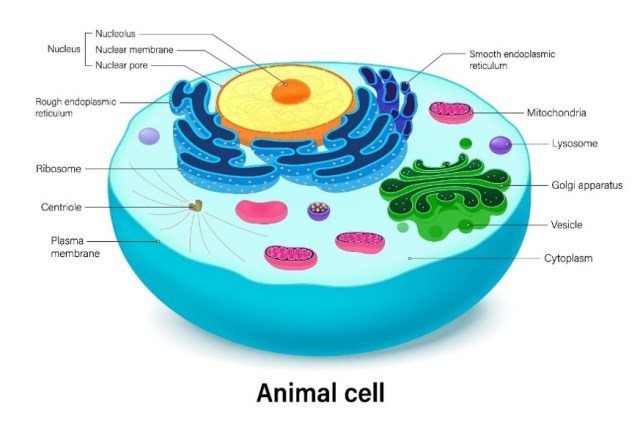
Short alt text description example [center outward]. “Animal cell diagram. Starting from the center is the nucleus. Surrounding the nucleus are the endoplasmic reticulum, Golgi apparatus, and mitochondria contained within the cell membrane.”
Image rendered from Google Gemini.
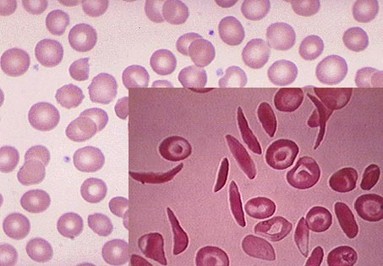
Short alt text description example. “Microscope image comparing typical round red blood cells with sickle-shaped red blood cells characteristic of sickle cell disease.”
Long alt text description example. “A histological microscope image of red blood cells. The larger background image starting on the left shows many typical red blood cells that appear round, disk-shaped, and relatively uniform in size, with pale centers characteristic of healthy red blood cells. An inset image in the lower right provides a comparison, showing a mixture of red blood cells, including numerous elongated, curved, crescent-shaped, or “sickle-shaped” cells. These sickle cells are noticeably narrower and more pointed at the ends than the round cells. The image illustrates the difference in cell morphology between normal red blood cells, which are flexible and circular, and sickle cells, which are abnormally shaped due to sickle cell disease. Both images are stained in shades of pink and viewed under a light microscope.”
Image rendered from Google Gemini.
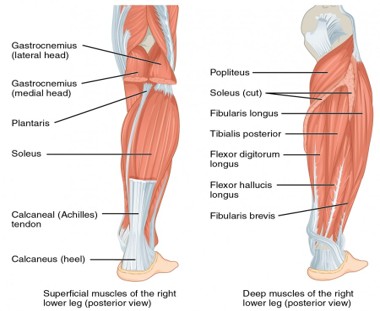
Short alt text description example. An anatomical diagram comparing superficial and deep posterior views of the right lower leg. The superficial view labels the gastrocnemius, plantaris, soleus, Achilles tendon, and calcaneus; the deep view labels the popliteus, soleus, fibularis muscles, tibialis posterior, and toe-flexor muscles. The diagram shows how superficial muscles cover deeper muscles and tendons in the posterior lower leg.
Long alt text description example. The anatomical diagram presents two side-by-side posterior views of the right lower leg. The illustration on the left shows the superficial muscles. The illustration on the right shows the deeper muscles that become visible when the superficial muscles, particularly the soleus, are removed or cut.
Muscles are illustrated primarily in shades of red and orange, tendons and connective tissues appear white or pale blue, and bones appear beige.
The left illustration shows the superficial muscles of the right lower leg from the back.
At the upper portion of the calf, the gastrocnemius is divided into two labeled sections:
- The lateral head of the gastrocnemius appears on the upper outer portion of the calf.
- The medial head of the gastrocnemius appears on the upper inner portion of the calf.
The two heads form the prominent upper portion of the calf muscle.
The plantaris is labeled below the gastrocnemius heads. The plantaris is shown as a small muscle with a long, narrow tendon extending down the posterior lower leg.
The soleus Ais labeled in the central portion of the calf, below the gastrocnemius. The soleus forms much of the broad muscle mass visible in the lower half of the calf.
The muscles narrow into the calcaneal, or Achilles, tendon near the lower portion of the leg. The Achilles tendon is shown as a wide, white and pale-blue connective structure extending toward the back of the heel.
The Achilles tendon attaches to the calcaneus, or heel bone, at the bottom of the illustration.
The right illustration shows the deep muscles of the right lower leg from the back. The superficial calf muscles have been removed or cut to expose the underlying structures.
The popliteus is labeled at the upper back portion of the lower leg, immediately below the knee. The popliteus is shown as a short, triangular muscle extending diagonally across the upper posterior leg.
The soleus cut is labeled near the upper calf. Portions of the soleus remain visible along the sides, indicating where the muscle has been cut to reveal the deeper muscle layer.
The remaining labeled deep muscles extend vertically through the posterior lower leg:
- The fibularis longus is labeled along the upper outer side of the lower leg.
- The tibialis posterior is labeled in the central deep portion of the calf.
- The flexor digitorum longus is labeled along the inner portion of the posterior lower leg.
- The flexor hallucis longus is labeled lower in the central-to-outer portion of the leg.
- The fibularis brevis is labeled along the lower outer portion of the leg.
The muscles transition into long tendons near the ankle. Several tendons continue behind or around the ankle toward the foot, although the structures within the foot are not individually labeled.
Note: Long alt text descriptions can be captured in live lecture notes, using EchoVideo, for example, where the polished transcript can be used. See “EchoVideo to Create Alt Text” under Quick Fix Tools below.
Image source and copyright
- Authors: J. Gordon Betts, Kelly A. Young, James A. Wise, Eddie Johnson, Brandon Poe, Dean H. Kruse, Oksana Korol, Jody E. Johnson, Mark Womble, Peter DeSaix
- Publisher/website: OpenStax
- Book title: Anatomy and Physiology 2e
- Publication date: Apr 20, 2022
- Location: Houston, Texas
- Book URL: https://openstax.org/books/anatomy-and-physiology-2e/pages/1-introduction
- Section URL: https://openstax.org/books/anatomy-and-physiology-2e/pages/11-6-appendicular-muscles-of-the-pelvic-girdle-and-lower-limbs
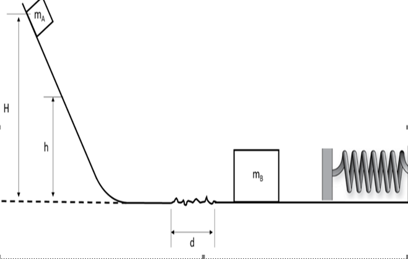
Short alt text description example. “Physics diagram showing a mass mA sliding down a frictionless incline from height H, crossing a rough patch of length d, colliding and sticking to mass mB, compressing a spring, and later returning up the incline to a height h.”
Long alt text description example. “A physics mechanics diagram shows a system involving gravitational potential energy, friction, an inelastic collision, and a spring. On the far left, a small block labeled mA is positioned near the top of a frictionless inclined ramp. The block starts from rest at a vertical height H above a dashed horizontal reference line representing the level track. The incline descends from left to right and curves smoothly into a horizontal surface. A second vertical measurement labeled h is drawn from the same reference level to an intermediate height on the ramp, indicating the final height the combined masses will reach later in the motion.
The horizontal track is mostly frictionless. Near the center of the diagram is a short rough section represented by a jagged line. This section has length d and is the only region where friction acts. A dimension marker beneath the rough patch identifies the distance d.
To the right of the rough patch is a larger block labeled mB, resting on the frictionless track. Further to the right is a horizontal spring attached to a rigid vertical wall. The spring is shown in its uncompressed state.
The motion implied by the problem proceeds from left to right. The small block mA slides down the frictionless incline and crosses the level surface and then collides with block mB. After the collision, the two masses stick together and continue moving as a single combined object. The combined masses compress the spring against the wall until they momentarily come to rest at maximum compression. The spring then expands, pushing the attached masses back toward the left. The masses travel leftward across the frictionless track, pass back through the same rough patch, and then move up the frictionless incline. The goal of the problem is to determine the maximum height h reached by the combined mass system after returning up the incline. Labels visible in the figure are mA, mB, H, h, and d. No numerical values are provided. The diagram is intended for an energy-conservation and momentum-conservation analysis involving gravity, frictional work, a perfectly inelastic collision, and spring potential energy.
Student Task [provided after the long alt text description or in a separate accessible document or in Blackboard]. A small mass, mA, is released from rest at a height, H. The small mass, mA, slides down the frictionless incline as shown and across the frictionless level surface where it eventually hits a patch of surface that has friction. The friction patch has a friction coefficient µk and has a length d. After the friction path, the small mass, mA, then collides with a larger mass, mB. The two masses stick together. Treat both masses as point masses. They then compress a spring with spring constant, k, a distance x as they come to a stop. The spring then shoots the masses, which are still attached to each other, back over the friction patch. The only part that has friction is the small patch of length d, the rest of the track is frictionless. The spring is an ideal spring and does not heat up. Determine an expression for h, how high the combined mass system will go up the incline. Your expression should only contain g, mA, mB, H, µk, and d (k and x are not allowed). Let’s say to the right is positive. It might be best to write some sentences here to explain to the grader your thought process when solving this problem.”
Image rendered by Google Gemini.
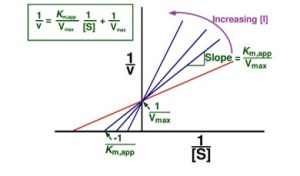
Short alt text description example. This visual is a Lineweaver–Burk plot of reciprocal reaction velocity, 1/v, versus reciprocal substrate concentration, 1/[S]. Lines representing increasing inhibitor concentration share the y-intercept 1/Vmax but have progressively steeper slopes and x-intercepts closer to zero. The plot shows that increasing inhibitor concentration raises the apparent Km while Vmax remains unchanged.
Image obtained from Example Lineweaver Burk Plot.
Quick Fix Tools for STEM
Using Blackboard’s AI Alt Text Assistant for Images
- Click the Ally indicator gauge next to your uploaded image, Blackboard content item, or PDF containing images.
- The feedback workflow will pinpoint the specific images without a description.
For each image, either:
- Select Auto-generate description to receive an AI-generated description;
- Enter your own description; or
- Mark the image as “Decorative” if it conveys no meaningful instructional information.
- Then, once you are satisfied with the description, select Add.
- As always, review and edit the description before applying it. Check the suggestion for factual accuracy, instructional purpose, context, and discipline-specific terminology.
*Additional videos demonstrating Blackboard Ally’s AI Alt Text Assistant are available at:
Using Ally’s Alt Text Generator and Adding Alt Text to PDFs in Blackboard
Using Blackboard’s Math Editor
- Alternative text is automatically generated when using Blackboard’s built-in Math Editor to create formulas and equations.
- Blackboard’s Content Editor supports LaTeX.
Using Microsoft Word to Add and Review Alt Text
Microsoft Word allows faculty to manually create alt text, edit AI-generated descriptions, mark images as decorative, and use the Accessibility Checker to identify images that may need descriptions. Alt text entered in Word is preserved when the document is shared electronically and can be accessed by screen readers to communicate the purpose and meaning of images. Microsoft also provides optional AI-generated descriptions that can serve as a starting point, but these descriptions should always be reviewed for accuracy, context, and discipline-specific terminology.
Steps for Adding Alt Text in Microsoft Word
- Right-click the image, chart, diagram, figure, graphic, or object in Microsoft Word.
- Select View Alt Text.
- In the Alt Text pane, either:
- Select Generate alt text for me, if that option is available.
- Review and read the AI-generated description.
- Correct any inaccurate terminology or missing instructional context that students need to understand.
- OR enter two to three sentences of your own alt text that communicates the image’s purpose and instructional relevance.
- OR mark the image as “Decorative” if it does not convey instructional information.
- Save the document after adding or updating the description.
Alternative Steps: Using Microsoft Word’s Accessibility Checker
Microsoft Word’s Accessibility Checker can help identify images that may be missing alternative text.
- Select the Review tab (or type Accessibility Checker in the Search bar).
- Choose Check Accessibility.
- Review any accessibility concerns identified by the Accessibility Assistant.
- Add or revise alt text as needed.
Using Microsoft PowerPoint to Add and Review Alt Text
Microsoft PowerPoint allows faculty to add alt text to images, charts, SmartArt graphics, shapes, and other visual objects. PowerPoint also provides AI-generated alt text descriptions and an Accessibility Checker that can help identify missing descriptions. Alt text entered into PowerPoint can be read by screen readers and helps ensure that students can access the instructional content conveyed by visual elements. Microsoft recommends reviewing all automatically generated descriptions before use.
Steps for Adding Alt Text in Microsoft PowerPoint
- Open the Microsoft PowerPoint file and select the image, chart, diagram, figure, graphic, or other visual object.
- Right-click the object and select View Alt Text.
- In the Alt Text pane, either:
- Select Generate alt text for me, if that option is available.
- Review and read the AI-generated description.
- Correct any inaccurate terminology or missing instructional context that students need to understand.
- OR enter two to three sentences of your own alt text,
- OR mark the image as “Decorative” if it does not convey instructional information.
- Close the pane and save the PowerPoint presentation.
Alternative Steps: Using Microsoft PowerPoint’s Accessibility Checker
PowerPoint’s Accessibility Checker can help identify slides and visual elements that may be missing alt text.
- Select the Review tab (or type Accessibility Checker in the Search bar).
- Choose Check Accessibility.
- Review any accessibility concerns identified by the Accessibility Assistant.
- Link students to a separate document or Blackboard page containing the full description. Add or revise alt text as needed. Using Speaker Notes for Long Descriptions For complex STEM visuals, the standard alt text field may not provide enough space to communicate all educationally relevant information. If a visual requires a detailed explanation that extends beyond two or three sentences, consider using the slide’s alt text for a short description and placing the longer description in Speaker Notes, a companion document, or a dedicated Blackboard “Figure Descriptions” page. This mirrors the short-description plus long-description approach recommended for other complex STEM visuals. In these situations, faculty may:
- Add a concise alt text description to the image itself.
- Place a detailed description on the next slide.
- Include a longer description in the Speaker Notes section.
- Note: Speaker Notes do not automatically transfer when a PowerPoint file is converted to a PDF. If detailed descriptions are stored in Speaker Notes, ensure students can access them through another accessible format if the slides are distributed as a PDF.
Using Microsoft Copilot to Draft Alt Text for an Image
Microsoft Copilot can help faculty quickly generate first drafts of alt text and long descriptions for individual images. This approach is particularly useful for STEM visuals that require context-specific descriptions, such as diagrams, graphs, maps, scientific figures, and laboratory images. Faculty can upload or paste an image into Copilot and prompt it to generate a short alt text description, a detailed long description, a figure caption, or multiple versions tailored to different instructional contexts.
Steps for Adding Alt Text in Microsoft Copilot
- Open Microsoft Copilot (basic/free version) and select the Deep-Thinking option if available. This encourages Copilot to provide a more detailed analysis of the image.
- Upload or paste the image into the Copilot chat.
- Enter a prompt such as: “Create alt text for this image that communicates its instructional purpose and key information for students in two to three sentences. Identify the image type, describe the subject and the essential information a student would need to understand the image, including the main takeaway.”
- Review the generated text description and edit it to ensure disciplinary accuracy, instructional relevance, and appropriate terminology.
- Revise the alt text as needed to reflect the instructional purpose of the image, especially if it is a chart, graph, scientific figure, equation, map, or technical diagram.
- Copy the final alt text into the appropriate field in Blackboard, Word, PowerPoint, Adobe Acrobat, or another application.
*Copilot can be prompted to assist with creating long alt text descriptions as well.
Note: Using Copilot in this manner is most effective for individual images or small groups of images that require thoughtful review and revision. While Copilot can quickly draft descriptions, faculty should verify factual accuracy, instructional meaning, scientific terminology, and context before using the descriptions in course materials.
Using Adobe Acrobat Pro for Adding Alt Text
Adobe Acrobat provides tools for reviewing document accessibility, adding alt text to images, and identifying accessibility issues in PDF files. Acrobat can also assist with tagging document elements and ensuring that screen readers can properly interpret document structure. For faculty working with scanned articles, PDF handouts, scientific figures, and STEM course materials, Acrobat can be an effective way to review and improve accessibility before distributing files to students.
Steps for Adding Alt Text in Adobe Acrobat
- Open the PDF in Adobe Acrobat Pro.
- Select All Tools and then select Prepare for Accessibility (or Accessibility, depending on your version).
- Choose Set Alternate Text.
- Acrobat will guide you through the images in the document one at a time.
- For each image:
- Enter or revise the alt text description.
- Mark decorative images as “Decorative” if they do not convey instructional information.
- Select Save & Close when finished.
Alternative Steps: Using Acrobat’s Accessibility Checker
Adobe Acrobat includes an Accessibility Checker that can identify common accessibility issues, including missing alt text.
- Open the PDF.
- Select All Tools and then select Prepare for Accessibility.
- Run the Accessibility Check.
- Review the report and address any flagged issues.
- Re-run the checker to verify corrections have been made.
Note: Acrobat’s automated accessibility tools can help identify missing descriptions, but they cannot determine instructional importance. Review all alt text to ensure it accurately reflects the image’s purpose, context, and discipline-specific terminology. For STEM content, diagrams, charts, equations, maps, scientific illustrations, and data visualizations often require more information than can fit in a standard alt text field.
Tip: Whenever possible, add alt text in the original Word or PowerPoint file and then export a new accessible PDF. Editing the source file is usually easier and preserves the description when the document is updated.
Using EchoVideo Transcripts to create Long Alt Text Descriptions for Complex STEM Images
Complex STEM visuals such as graphs, diagrams, equations, and models often need more explanation than short alt text can hold. If you already explain a visual in a recorded lecture, the EchoVideo transcript gives you a first draft of its long description. This guide shows how to turn that explanation into a description students can use without watching the video.
Every complex image needs two parts: short alt text on the image and a long description placed nearby. The transcript is a starting draft for the long alt text description, not the finished product.
Before You Start
Is this method a good fit?
This method works best when you already explain the visual aloud in an EchoVideo recording, the explanation is mostly words (trends, relationships, processes, or structures), and you plan to reuse the visual. Choose another approach when:
- The visual is not covered in any recording. Writing the description directly is faster.
- The visual is mostly equations or notation. Use an equation editor instead.
- The visual is mostly data values. A data table usually works better.
- Students need the image before the lecture is recorded. Write the description in advance so access is not delayed.
Do you need a separate long alt text description?
Not always. If students see the visual only inside an accessible EchoVideo recording, containing accurate captions and the transcript where you describe it clearly, the recording may already provide equivalent access. Create a separate description when the image also appears in slides, documents, or Blackboard pages, or when students need it without watching the full recording. Either way, the image still needs short alt text.
The Process at a Glance
- Plan the visual and add short alt text.
- Describe the visual clearly while recording.
- Find and copy the explanation in the transcript.
- Edit the excerpt into a stand-alone description.
- Check the description against the image.
- Publish the description and save it for reuse.
Reminder: If it suits your needs, the entire video can be linked to Blackboard and shared with students in the class. See Using EchoVideo Transcripts for Long Alt Text document for more complete instructions and tips.
General Accessibility Guidance
- American Foundation for the Blind (AFB): Writing Effective Image Descriptions
- Microsoft: Everything You Need to Know to Write Effective Alt Text
- Microsoft: Add Alternative Text to a Shape, Picture, Chart, SmartArt Graphic, or Other Object
- W3C Web Accessibility Initiative (WAI): Images Tutorial
- W3C Web Accessibility Initiative (WAI): Alt Text Decision Tree
- W3C Web Accessibility Initiative (WAI): Complex Images
- W3C Web Accessibility Initiative (WAI): Resources on Alternative Text for Images
Accessibility Guidance in the Disciplines
- American Mathematical Society: Guidance for Enhancing Digital Accessibility of Mathematics
- American Chemical Society: Alternative Text and Image Descriptions
- Harvard University: Accessible Math
About the Author
Kimberly DeTardo-Bora, PhD
Professor of Criminal Justice & Criminology
Accessibility Liaison to the College of Science
Dr. Kim DeTardo-Bora represents the College of Science in Marshall Online’s College Accessibility Liaison Program. This program brings together staff and faculty with discipline-specific expertise to identify accessibility challenges, share practical guidance, and support more inclusive digital learning experiences across Marshall University. Drawing on her experience teaching criminal justice and criminology, DeTardo-Bora developed this resource to help colleagues address accessibility questions that arise in their everyday teaching and work.
Created by faculty, for faculty through Marshall Online’s College Accessibility Liaison Program. Updated November 8, 2026.
Disclaimer: This resource is for guidance only and does not replace legal advice. WCAG and related accessibility guidance establish the expectation that students must have equivalent access to information conveyed through visual content. However, accessibility standards do not prescribe a single method for describing STEM diagrams, graphs, figures, equations, or models. The F.I.T. framework, directional description strategies, triage process, examples, and workflows presented in this resource are recommended approaches developed to help STEM faculty implement accessibility practices in ways that communicate disciplinary meaning and support student learning.