Residency I Clinical Performance for Academic Year 2025-2026
The Residency I Evaluation is a clinical performance assessment based on the Danielson Framework for Teaching. Candidates are evaluated at both midterm and final checkpoints across the domains of Planning and Preparation, Learning Environment, Learning Experiences, and Principled Teaching. Results are based on 70 midterm evaluations and 75 final evaluations completed during the 2025–2026 academic year. Candidates were evaluated using the Danielson Framework for Teaching at both the midterm and final stages of the Residency I clinical experience.
Scale: 4 = Distinguished, 3 = Proficient, 2 = Basic, and 1 = Unsatisfactory. Growth Score represents the difference between the final mean and midterm mean. Positive values indicate improvement between evaluation checkpoints.
Residency I candidates demonstrated overall growth from a midterm mean of 3.03 to a final mean of 3.26, representing an average increase of 0.23 points across evaluated teaching competencies.
Residency I Candidate Growth by Danielson Domain
Residency I candidates demonstrated growth across all four Danielson Framework domains from midterm to final evaluation. The largest increase was observed in Planning and Preparation (+0.26), while all domains concluded within the Proficient performance range.
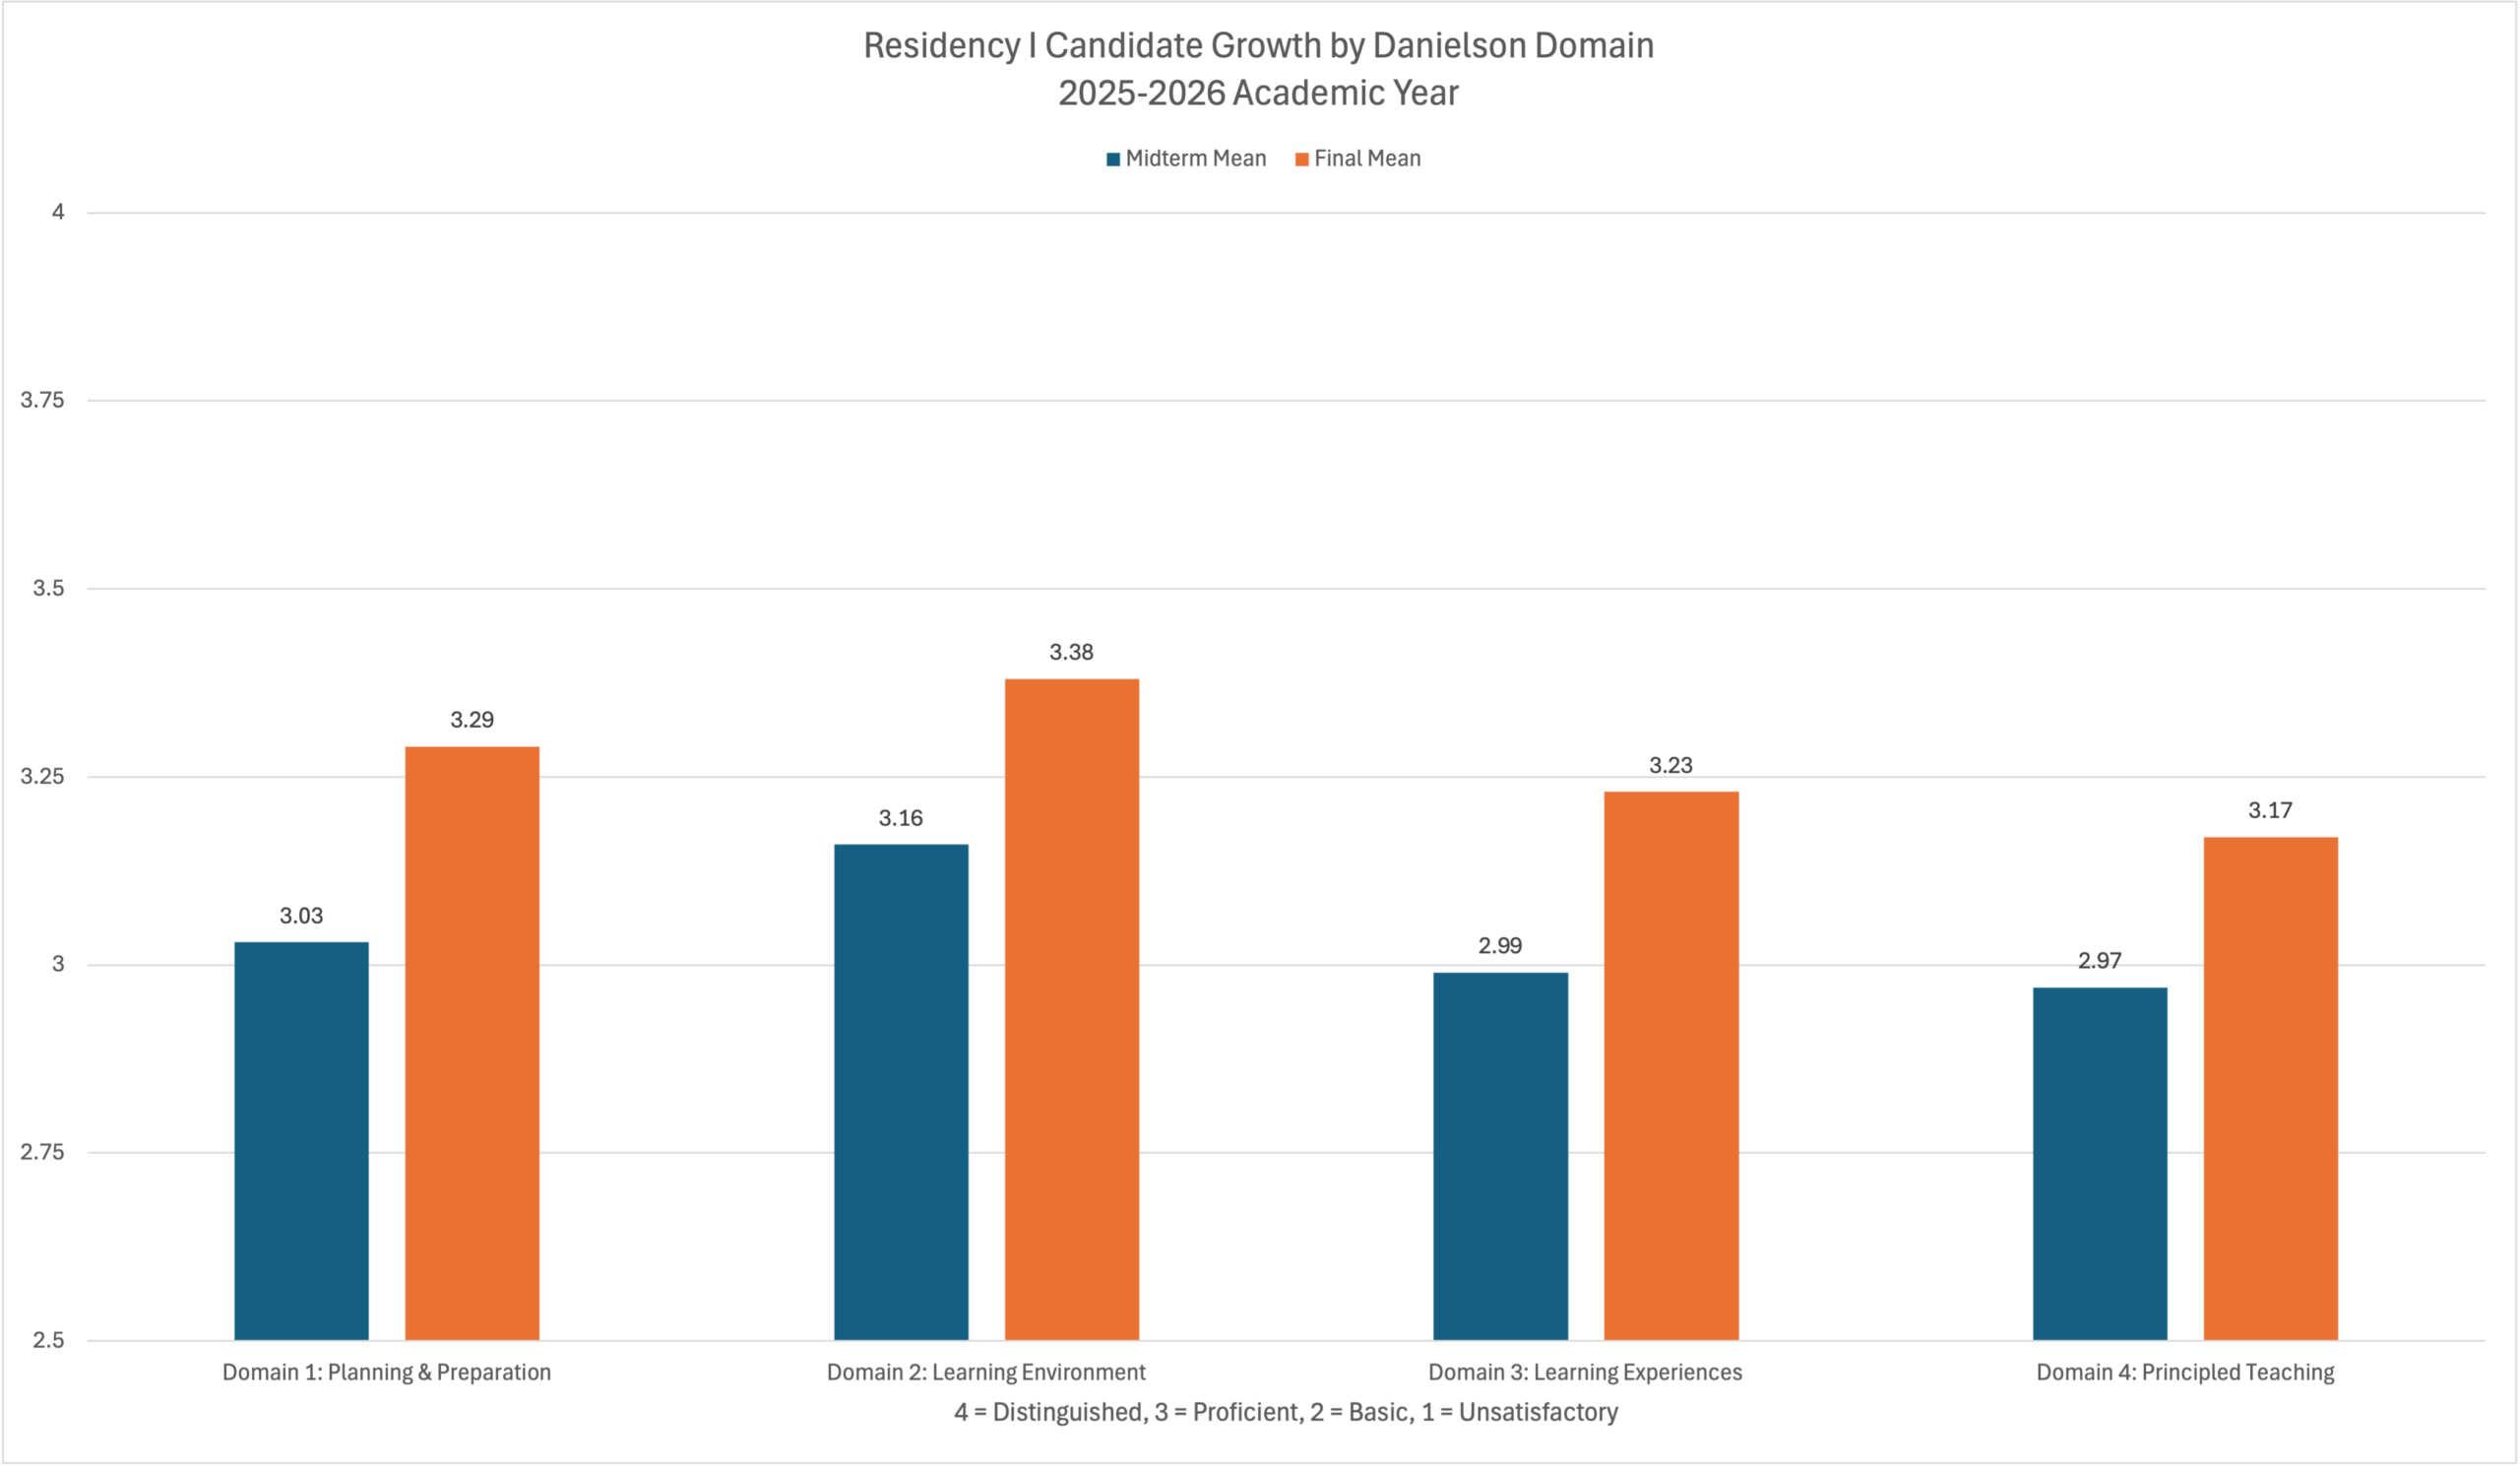
| Danielson Domain | Midterm Mean | Final Mean | Growth |
|---|---|---|---|
| Domain 1: Planning & Preparation | 3.03 | 3.26 | +0.23 |
| Domain 2: Learning Environments | 3.16 | 3.38 | +0.22 |
| Domain 3: Learning Experiences | 2.99 | 3.23 | +0.24 |
| Domain 4: Principled Teaching | 2.97 | 3.17 | +0.20 |
| Overall | 3.03 | 3.26 | +0.23 |
Danielson Framework Component-level Results
The table below provides component-level results for each Danielson Framework for Teaching component evaluated during Residency I. Growth scores were calculated by subtracting the midterm mean from the final mean. Positive values indicate improvement between evaluation checkpoints.
| Danielson Framework Component | Midterm Mean | Final Mean | Growth Score |
|---|---|---|---|
| D1: Applying Knowledge of Content and Pedagogy | 3.09 | 3.29 | +0.20 |
| D1: Knowing and Valuing Students | 3.20 | 3.46 | +0.26 |
| D1: Setting Instructional Outcomes | 2.97 | 3.28 | +0.31 |
| D1: Using Resources Effectively | 3.03 | 3.27 | +0.24 |
| D1: Planning Coherent Instruction | 3.00 | 3.25 | +0.25 |
| D1: Designing and Analyzing Assessments | 2.90 | 3.18 | +0.28 |
| D2: Cultivating Respectful and Affirming Environments | 3.26 | 3.46 | +0.20 |
| D2: Fostering a Culture for Learning | 3.21 | 3.41 | +0.20 |
| D2: Maintaining Purposeful Environments | 3.02 | 3.25 | +0.23 |
| D2: Supporting Positive Student Behavior | 3.12 | 3.39 | +0.27 |
| D2: Organizing Spaces for Learning | 3.10 | 3.39 | +0.29 |
| D3: Communicating About Purpose and Content | 3.00 | 3.18 | +0.18 |
| D3: Using Questioning and Discussion Techniques | 2.91 | 3.21 | +0.30 |
| D3: Engaging Students in Learning | 3.05 | 3.29 | +0.24 |
| D3: Using Assessment for Learning | 2.87 | 3.12 | +0.25 |
| D3: Responding Flexibly to Student Needs | 3.12 | 3.34 | +0.22 |
| D4: Engaging in Reflective Practice | 3.07 | 3.23 | +0.16 |
| D4: Documenting Student Progress | 2.94 | 3.11 | +0.17 |
| D4: Engaging Families and Communities | 2.90 | 3.06 | +0.16 |
| D4: Contributing to School Community and Culture | 2.89 | 3.12 | +0.23 |
| D4: Growing and Developing Professionally | 2.95 | 3.20 | +0.25 |
| D4: Acting in Service of Students | 3.06 | 3.27 | +0.21 |
Continuous Improvement
Residency I evaluation results are reviewed annually by faculty and program leadership as part of the COEPD Quality Assurance System. Findings are used to monitor candidate development, inform clinical supervision practices, support curriculum discussions, and identify opportunities for continuous improvement. Particular attention will continue to be given to components related to assessment practices, student progress monitoring, family engagement, and professional responsibilities as part of ongoing program review efforts.