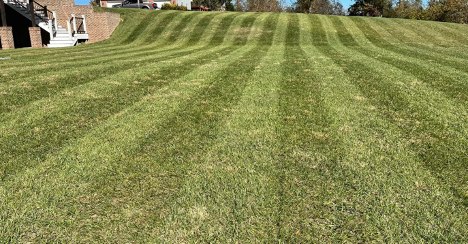
I had fun with a blog about a month ago drawing from my past on how it shaped my career path, so today, I decided to venture into an exploration of how my dual passions for yard work and data management intersect in surprisingly insightful ways. I call my mowing a personal passion, but my wife and kids call it my obsession. With spring in full swing, I have already had the pleasure of mowing my lawn fix times, and it is during these peaceful moments that I often come up with new ideas for reports and features to existing reports. Often when I’m laying my stripes on the yard, you will see me transcribing those ideas via Siri to my notes. From my mowing, I can draw parallels not only to maintaining data systems and institutional planning but also to crafting compelling, data-rich visualizations with PowerBI.
The First Cut: Laying the Foundation for Data and Aesthetics
Just as the initial mow of the season sets the stage for a healthy, vibrant lawn, bringing the drab brown winter “rust” back to a luscious, rich, thick green lawn, setting up your data systems to be consumed within PowerBI establishes the groundwork for insightful analysis and captivating visualizations. This foundational step is crucial as it ensures that the data is not only clean and organized but also primed for visual storytelling. A well-maintained lawn becomes a canvas for garden landscapes, much like a well-structured dataset becomes the foundation for impactful visual narratives.
Regular Upkeep: Nurturing Growth and Clarity
By my fifth lawn mowing session, the importance of consistency becomes clear. Regular lawn care promotes lush growth and prevents issues, paralleling the necessity of consistent data cleaning, updates, and analysis. With datasets and PowerBI reports, this translates into continuously refining said datasets, updating dashboards, and ensuring that visualizations remain accurate, relevant, and engaging. Just as removing weeds and dead growth can revitalize a lawn, pruning outdated or irrelevant data can clarify and enhance your visualizations. I compare fertilizing the yard for rapid, lush growth to promoting your data reports to enhance insights.
Weathering Changes: Adaptability in Lawn Care and Data Trends
Adapting to the unpredictable nature of weather mirrors the need to adjust to changing data landscapes and organizational needs. Rain or drought may alter my mowing schedule, just as market shifts or new research findings might necessitate a pivot in your data visualization approach. PowerBI enables you to respond to these changes dynamically, offering tools to adjust visualizations swiftly and effectively, ensuring that your data stories remain as relevant and resilient as a well-tended yard. But you have to watch out for moles, whether those moles are upheaving your yard or appearing in your datasets (bad data), they have to be dealt with to ensure smooth operation.
Harvesting the Rewards: The Satisfaction of Visual Impact
There is a deep sense of satisfaction in viewing a freshly mowed lawn, paralleled by the gratification of developing a clear, impactful data visualization. PowerBI takes this a step further by allowing the creation of interactive, data-rich visual narratives that not only inform but also engage and persuade. The process of transforming raw data into clear, compelling visualizations shares the same rewarding essence as transforming a wild yard into a manicured landscape.
Conclusion: Unearthing the Synergies Between Yard Work and Data Visualization
The journey from lawn care to data visualization might seem unlikely at first glance, but both require planning, regular maintenance, adaptability, and a keen eye for the final aesthetic. Whether I am pushing my mower or in front of a computer pushing data into a PowerBI dashboard, the principles of care, attention, and refinement guide my efforts toward achieving growth, clarity, and impact.
So, the next time you are enjoying the tranquility of mowing your yard, consider how the principles guiding your efforts can illuminate your approach to data management and visualization. And remember, whether it is cultivating the perfect lawn or crafting an engaging data story, both pursuits thrive on dedication, creativity, and a bit of elbow grease.
Now, if you will excuse me, it is time to decide between firing up the lawnmower or PowerBI for my next project. Either way, I am looking forward to the satisfaction that comes from a job well done.
Happy mowing and visualizing, with data!
Brian M. Morgan
Chief Data Officer, Marshall University