Discover the Power of Institutional Data with Interactive Dashboards!
Unlock valuable insights into our institution’s data through our newly launched interactive dashboards, now accessible on the IRP website. These cutting-edge dashboards empower students, staff, and community members to delve into key data points effortlessly, revolutionizing the way we engage with institutional information.
What Can You Expect?
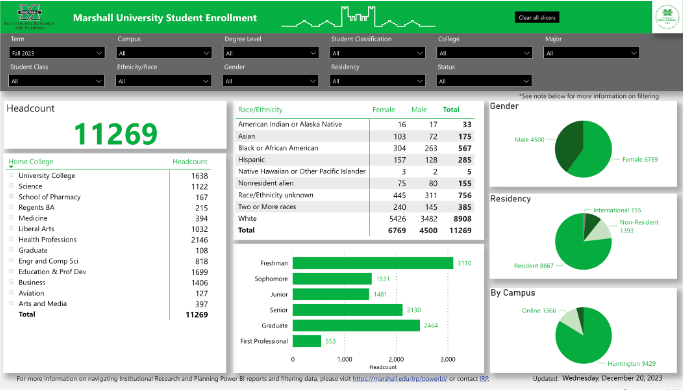
Dynamic Insights: From enrollment trends to faculty demographics, explore a myriad of data dimensions through our intuitive dashboards.
Tailored Views: Customize your experience with slicers, allowing you to focus on the information that matters most to you.
User-Friendly Interface: Whether you’re a seasoned data analyst or a newcomer, our interface is designed for seamless navigation and exploration.
Ready to Dive In?
Access our interactive dashboards by navigating to https://www.marshall.edu/irp/institutional-data/
Need Some Help?
Embark on your data exploration journey with our comprehensive guide to the basics of Power BI, designed to assist you every step of the way.
Ideas or Requests?
We’re here to tailor our dashboards to your needs. Reach out to us with any suggestions or requests for dashboard content – your feedback helps shape our data-informed approach!