A. Grade Point Average (GPA) Marshall University Forensic Science Program Average Incoming Undergraduate GPA versus Exit MSFS GPA
Graph A: This graph provides the average undergraduate GPA for students coming into the Forensic Science Program as well as the average GPA upon graduation from the Program.

Graph A: Marshall University Forensic Science Student Average Undergraduate GPA vs. Exit MSFS GPA
B. Employment Statistics: Marshall University Graduate Employment Statistics
Table B: Breakdown of employment by category for graduates of each class of the Forensics Science Program as well as the totals for all graduates from the past 10 years.
10-Year Employment Statistics
| Class | Total Students | Forensic Science* | Forensic Science Related | Non-Forensic Science Related | Advanced Degrees | Did Not Respond |
|---|---|---|---|---|---|---|
| 2014 | 19 | 18 (94.70%) | 0 (0.00%) | 0 (0.00%) | 1 (5.30%) | 0 (0.00%) |
| 2015 | 19 | 18 (94.70%) | 0 (0.00%) | 0 (0.00%) | 1 (5.30%) | 0 (0.00%) |
| 2016 | 15 | 10 (66.70%) | 2 (13.33%) | 0 (0.00%) | 2 (13.33%) | 1 (6.67%) |
| 2017 | 17 | 13 (76.00%) | 0 (0.00%) | 0 (0.00%) | 1 (5.88%) | 3 (17.65%) |
| 2018 | 15 | 9 (60.00%) | 0 (0.00%) | 0 (0.00%) | 1 (6.60%) | 3 (20.00%) |
| 2019 | 18 | 14 (77.77%) | 3 (16.66%) | 1 (5.55%) | 0 (0.00%) | 0 (0.00%) |
| 2020 | 12 | 6 (50.00%) | 1 (8.33%) | 1 (8.33%) | 1 (8.33%) | 2 (16.67%) |
| 2021 | 17 | 12 (70.50%) | 2 (13.33%) | 0 (0.00%) | 0 (0.00%) | 3 (17.65%) |
| 2022 | 11 | 7 (63.63%) | 0 (0.00%) | 0 (0.00%) | 0 (0.00%) | 2 (18.18%) |
| 2023 | 7 | 6 (85.71%) | 1 (14.29%) | 0 (0.00%) | 0 (0.00%) | 0 (0.00%) |
| 2024 | 12 | 11 (91.67%) | 0 (0.00%) | 0 ( 0.00%) | 0 (0.00%) | 0 (0.00%) |
| Total | 162 | 124 (76.54%) | 9 (5.56%) | 2 (1.23%) | 7 (4.32%) | 14 (8.64%) |
* Individuals classified as having a Forensic Science job are those in the actual field of Forensic Science after graduation with respect to the relevancy of their degree obtained. Examples of this would be as follows: Laboratory or field work with forensic governmental agencies, private corporations, etc.
Table B: Employment Statistics 2024 (PDF)
C. Professional Development Marshall University Forensic Science Graduate Student Presentation at the American Academy of Forensic Sciences Annual Meeting or MAAFS Regional Meeting
Graph C: This graph provides the number of second-year students attending compared to the total number of students enrolled in the program for that year. “Percent Presenting” is based on the number of students who were selected to present a poster or podium presentation at the meeting compared to the total number of second-year students in the Program.
Second-year students have completed research projects to be eligible for national meeting presentation.
Important Note: 2021 shows 0 attendance due to Covid. Attendance from 2022 and 2023 include virtual attendance.

Graph C: Students at AAFS National or other Regional Meetings: Percentage (%) of Presenters and Attendees per Class per Year
D. Incoming Student GRE Score Averages
Graph D1 & D2: These graphs provide average GRE scores of applicants accepted into the MUFS graduate program for the past 5 years in the areas of verbal, quantitative, and writing.
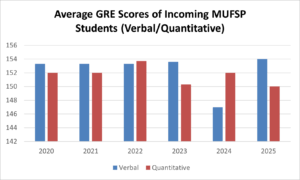
Graph D1: Average GRE Scores of Incoming MUFSP Students (verbal/Quantitative)
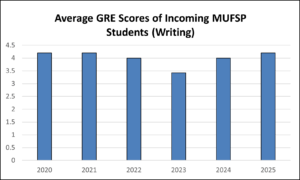
Graph D2: Average GRE Scores of Incoming MUFSP Students (Writing)
E. Enrollment & Graduates Data
Table E; Student enrollment for the past three academic years: total enrollment, number enrolled in each emphasis, and number graduated.
|
Masters of Science in Forensic Science |
Academic Year: Past 3rd Year 2022 – 2023 |
Academic Year: Past 2nd Year 2023- 2024 |
Academic Year: Previous Year 2024 – 2025 |
|---|---|---|---|
| # of full time students enrolled in degree program | 18 | 19 | 11 |
| # of students enrolled in each concentration /emphasis/ track (if applicable) |
DNA: 16 Chemistry: 14 Crime Scene: 16 Digital: 14 |
DNA: 16 Chemistry: 13 Crime Scene: 18 Digital: 9 |
DNA: 10 Chemistry: 9 Crime Scene: 9 Digital: 4 |
| # of graduates in reported in each year | 7 | 12 | 6 |
Table E: Enrollment & Graduates Data 2025 (PDF)
F. Internship, Research Project, & Capstone Experience Information
Table F: Summary of research experiences, project titles, and host agencies.
Past 3rd Academic Year 2022-2023
| Type of Experience | Title or Topic of Project / Area of Study: | Location: |
|---|---|---|
| Internship | Optimization and Expansion of Cannabinoid Assays for Quantitation of Delta-8 THC | Alabama Department of Forensic Sciences |
| Internship | Finding A Needle In a Haystack: one laboratory’s quest to streamline DNA profile interpretation | Palm Beach County Sherriff’s Office |
| Internship | Forensic Acquisition and Inspection of Aftermarket Vehicle Infotainment Systems | Marshall University Digital Forensics Laboratory |
| Internship | Oral Fluid Validation for LC/TQD | North Louisiana Criminalistics Laboratory in Shreveport, Louisiana |
| Internship | Development, Testing, and Comparison of Decontamination Methods for Drugs and Ignitable Liquids from Mobile Devices | Marshall University Forensic Science Center in conjunction with the United States Secret Service |
| Internship | Probabilistic Genotyping Analysis of Trace DNA and Transfer Evidence | Marshall University Forensic Science Graduate program |
| Internship | Validation of a Manual Selective Degradation Method of Differential Extraction | Kentucky State Police Central Laboratory in Frankfort, Kentucky |
| Internship | Qualitative Analysis of Xylazine, Nitazenes and Common Opioids/Analogs by Liquid Chromatography Tandem Mass Spec-troscopy (LC/MS/MS) Following Collection with the M-Vac® Wet-Vacuum System | Marshall University Forensic Science Graduate program in conjunction with US DHS |
| Internship | Internal Validation of the M-Vac® for Forensic Use | Marshall University Forensic Science Center DNA Laboratory |
| Internship | Known Hash Filtering: An Efficient Way to Eliminate Irrelevant Files and Show Files of Interest in Digital Examinations | North Carolina State Crime Laboratory in Raleigh, North Carolina |
| Internship | Validation of the DANI DiscovIR-GCDetection System & Identifying Complex Isomers of Controlled Substances | West Virginia State Police Forensic Laboratory |
| Internship | Internal Validation of Janovsky Color Test and Testing Platinum Chloride Microcrystalline Method for Benzodiazepines | North Carolina State Crime Laboratory in Raleigh, North Carolina |
Past 2nd Academic Year 2023-2024
| Type of Experience | Title or Topic of Project / Area of Study: | Location: |
|---|---|---|
| Internship | Investigation of the Impact of the Fire Debris Sample Extraction Process on Latent Prints | Marshall University Forensic Science Department |
| Internship | Impact of Sound Suppressors on Gunshot Residue Deposition. | Harris County Institute of Forensic Sciences in Houston, Texas |
| Internship | Determining Discriminatory Power for Tool Paint (FTIR, MSP, SEM-EDS) and Hot Melt Adhesives (XRF, SEM-EDS, FTIR) | ATF Forensic Science Laboratories (FSL) in Ammendale, Maryland |
| Internship | Validation of Tetrahydrocannabinol Acid Derivatization | West Virginia State Police Forensic Laboratory |
| Internship | Persistence and Recovery of Touch DNA on Door Handles Over Time | Marshall University Forensic Science Department |
| Internship | Implementation of the Intermountain Bone and Tooth Extraction and Purification Protocol to Improve DNA Extraction from Bone | Palm Beach County Sheriff’s Office |
Past Academic Year 2024-2025
| Type of Experience | Title or Topic of Project / Area of Study: | Location: |
|---|---|---|
| Internship | Analysis of IL by GC-MS with H2 Carrier Gas | Pinellas County Forensic Laboratory |
| Internship | SpermX extraction with a GenSpin Tube | Palm Beach County Sherriff’s Office |
| Internship | Evaluation of Vapor Pressures of Ignitable Liquids Water and Fire Debris Analysis, and the Effects on Extraction | ATF Forensic Science Laboratories (FSL) in Ammendale, Maryland |
| Internship | MSTFA Derivatization of cannabinoids for GC/MS analysis | Kentucky State Police, Eastern Laboratory |
Table F: Internship, Research Project, & Capstone Experience Data 2025 (PDF)